How to Lower Your Restaurant
Food Cost to 28%
A Step-by-Step Guide
At $500,000 in annual food sales, the difference between 38% and 28% food cost is $50,000 in recovered profit. This guide walks through the four levers that produce that recovery — with real-dollar examples you can start executing this week.
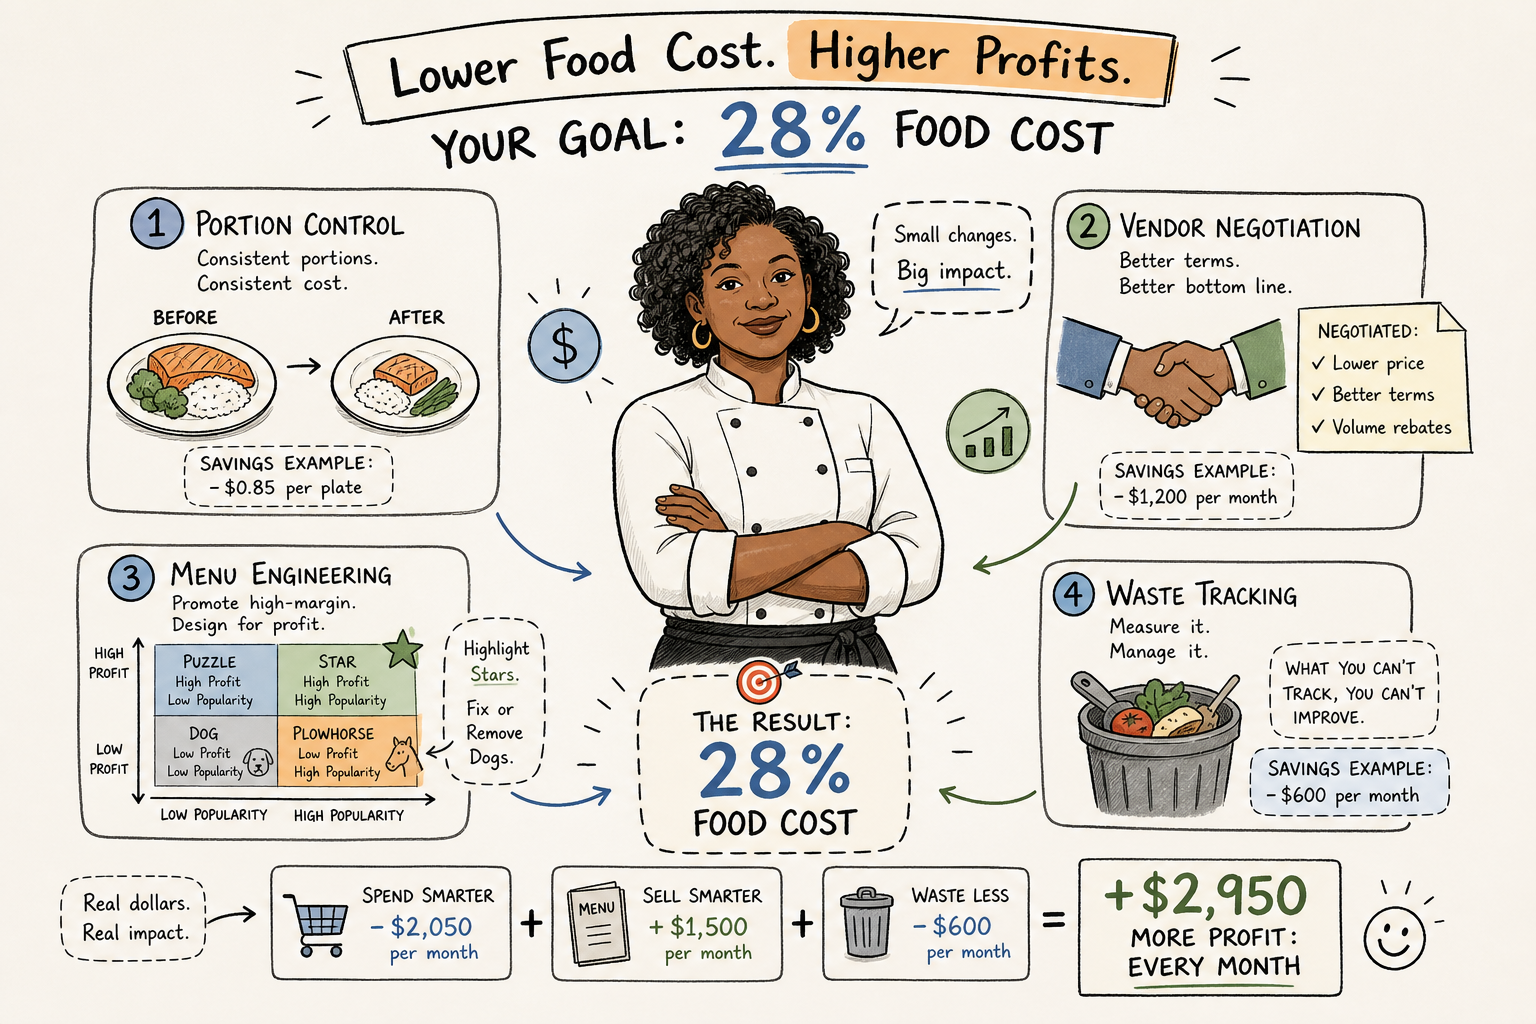
The four levers that close the gap to 28% food cost: portion control, menu engineering, vendor negotiation, and waste tracking — applied consistently every week.
Learning how to lower restaurant food cost to 28 percent starts with one uncomfortable truth: most independent operators running 35–44% food cost treat it as a revenue problem. They assume they need more tables, more orders, more customers. The real problem sits inside the cost structure, not outside it.
At Profit Kitchen, this gap is the single most common issue identified in the first two weeks of a new client engagement. Four specific levers drive the recovery: portion control, menu engineering, vendor negotiation, and waste tracking. This guide walks through each one with real-dollar examples and a sequence you can start executing this week.
Calculate your real food cost before you touch anything else
The first failure point isn't high food cost. It's not knowing what it actually is. Most operators either guess at their food cost or pull the number from a monthly P&L that's already too old to act on. Before you adjust a recipe or renegotiate a supplier contract, you need an accurate baseline.
The food cost formula
The formula is: (Beginning Inventory + Purchases − Ending Inventory) ÷ Food Sales × 100. Here's a worked example. Beginning inventory of $4,000, purchases of $10,000, ending inventory of $3,500, and food sales of $40,000. Food used equals $10,500. Divided by $40,000, that's a 26.25% food cost.
Run this weekly, not monthly. A monthly calculation tells you about a problem after it's compounded for four weeks. A weekly calculation gives you a 7-day window to identify and correct it before real damage accumulates.
Dish-level costing to find your most expensive items
The period-level number tells you where you are. Dish-level costing tells you why. Take a Chicken Bowl priced at $6.75. If the total recipe cost is $1.80, the dish food cost runs 26.67%. The 28% target cost on that item is $1.89, meaning you're already ahead by $0.09 per cover. At 500 bowls sold, that's $45 in margin protection from one dish running correctly. Apply the same math to every item on your menu and find the ones running above 32%. Those are your starting point.
What your food cost number means by concept type
Benchmarks vary by format. Full-service restaurants typically land between 30–35%. Fast-casual sits around 28–32%. QSR runs lower, usually 25–30%. If you're above the top of your range, the next four sections are your fix. If you're already within range, the system in the final section is what keeps you there.
Portion control: the highest-ROI lever most operators underuse
Of all the cost levers available to an independent operator, portion control delivers the fastest and most measurable return. The tools are inexpensive. The execution is repeatable. And the savings accumulate across every single service, seven days a week.
Why protein portions are where the money bleeds first
Proteins are the highest cost-per-ounce ingredient on almost every menu, which makes them the highest-risk category for daily over-portioning. A line cook plating one extra ounce of chicken per cover doesn't feel significant in the moment. Across 200 daily covers at $0.20 per ounce, that one-ounce drift costs $40 per day and $14,600 per year, disappearing silently if you're not measuring it.
Standardizing portions with recipe cards and measuring tools
The tools that eliminate this problem are basic: digital scales, portion scoops, ladle sets, and pre-portioned containers. The discipline is in building recipe cards that specify exact weights and ensuring line staff actually use them during every service. Consistent portioning also reduces remakes and plate waste, so the ROI compounds beyond food cost alone.
Yield management and what trim loss is actually costing you
Yield is the percentage of a raw ingredient that becomes usable product after trimming, cooking, and cooling. If you're buying protein at $8 per pound but the usable yield after trim is 75%, your real cost is $10.67 per pound, not $8. Most operators who claim disciplined purchasing are still overpaying because they're costing recipes on raw weight rather than yield-adjusted weight. Fix this one calculation and your food cost percentage often drops a full point or two without a single supplier conversation. Enforcing full portion and yield standards typically delivers $18,000 to $25,000 in annualized savings per location.
Menu engineering to lower food cost to 28%
Menu engineering isn't a pricing exercise. It's a profitability audit. A well-executed pass can move overall food cost by 3–7 percentage points, which at $40,000 in monthly food sales translates to $1,200 to $2,800 in monthly cost savings without adding a single new customer.
Stars, plowhorses, puzzles, and dogs
Every menu item falls into one of four quadrants. Stars are high popularity and high margin: protect them. Plowhorses are high popularity and low margin: these get your attention first because volume amplifies the margin problem. Puzzles are low popularity and high margin: test better descriptions or placement before writing them off. Dogs are low popularity and low margin: they're costing you money every day they stay on the menu.
Start with your plowhorses. Because they're your most-ordered items, even a small recipe or portion adjustment produces an outsized volume impact on total food cost percentage.
Recipe tweaks vs. repricing
Recipe and portion modifications produce the largest food cost reductions, not repricing alone. Trimming a sauce portion from 2 ounces to 1.5 ounces on a high-volume plowhorse item, across 300 daily covers, can generate hundreds of dollars in monthly savings without affecting the guest experience. Repricing that same item by $0.50 helps too, but the impact is smaller when used without a recipe change. Combine both levers and you create a meaningful shift in your overall percentage.
When pulling an item off the menu is the right call
A dog doesn't just lose money on food cost. It creates spoilage risk from dedicated ingredients, adds complexity to your prep line, and occupies menu real estate that could be selling a higher-margin item. Removing a low-volume, low-margin item typically produces three compounding benefits: lower ingredient waste, simpler inventory, and reduced kitchen labor.
Vendor negotiation tactics that directly lower ingredient costs
Many operators negotiate with suppliers once at opening and don't revisit pricing for years. Your distributor rep isn't going to volunteer a price reduction. You have to ask for it, and you have to ask with data and volume leverage behind you.
Fixed-price contracts for 3 to 6 months work well for dry goods and stable proteins because they eliminate opportunistic markups when commodity markets move. Index-based pricing works better for volatile proteins and produce, tying your cost to a published market benchmark rather than whatever the rep decides to quote that week. Adding SKU rationalization to any contract arrangement — reducing the number of approved items in a category — commonly adds another 5–15% on dry goods alone.
Waste tracking: stopping the daily leak you can't see on your P&L
Your P&L shows what you spent on food. It doesn't show you where that food went. Over-portioning, prep overages, and spoilage from poor inventory rotation can account for 30–40% of a restaurant's total food waste. You can't reduce what you're not measuring.
How to set up a daily waste log
Keep the format simple. For each entry, record four things:
- Item — what was wasted
- Quantity — how much
- Reason — spoilage, over-prep, returned plate, or trim
- Dollar value — estimated cost of the waste
Log it during service, not from memory at end of shift. Review it weekly. The goal isn't to identify who made a mistake — it's to identify patterns. If the same prep item appears three times in a week under "over-prep," that's an ordering or production scheduling problem.
Theoretical vs. actual food cost
Theoretical food cost is what your cost should be based on recipes, portion sizes, and your sales mix — assuming perfect execution. Actual food cost is what the inventory formula produced. The variance between them points directly at waste, over-portioning, and theft. A $500 weekly gap on $10,000 in food used is a 5% unexplained loss. Annualized, that's over $26,000 vanishing into a category you haven't investigated yet.
The system that keeps food cost at 28% instead of drifting back to 38%
Many operators who complete a cost reduction project see their food cost improve for several weeks, then watch it drift back — not because they forgot what to do, but because the accountability system that was holding everything in place stopped being used consistently.
Operational habits revert under pressure. A busy weekend, a staff change, a new supplier rep — and suddenly portions are creeping back up, the waste log goes unfilled, and vendor pricing goes unreviewed for months. Knowledge alone doesn't hold the gains. A weekly system does. The operators who sustain 28% food cost are reviewing their numbers every week.
The Profit Kitchen Pulse tracks food cost benchmarks, portion compliance signals, and vendor cost trends on a weekly basis. More importantly, it distills the week's data into one prioritized action item so operators know exactly what to move on next. One-on-one coaching through the monthly strategy call ensures that action item gets executed, not just noted.
The math is the motivation: start this week
At $500,000 in food sales, moving from 38% to 28% food cost recovers $50,000 in annual profit. The four levers in this guide — portion control, menu engineering, vendor negotiation, and waste tracking — each contribute a measurable piece of that recovery. None of them require major capital. They require consistent weekly execution.
Start with the food cost formula today. Run your period-level number, then cost out your top five selling dishes at the recipe level. That calculation will tell you more about where your money is going than any report you've reviewed this year.
How long does it take to lower restaurant food cost to 28%?
Most operators see measurable improvement within 4 to 8 weeks of implementing weekly food cost tracking alongside portion standardization and a first-round vendor negotiation. Reaching and sustaining 28% typically takes 3 to 6 months of consistent weekly execution, depending on your starting point and concept type.
Which lever has the highest ROI for lowering food cost?
Portion control and yield management consistently deliver the fastest returns because they reduce waste on every single cover served. Menu engineering compounds those gains by improving margin mix across your whole menu. Vendor negotiation produces larger one-time savings but requires more lead time to execute well.
What is a good food cost percentage for a restaurant?
It depends on your concept. Full-service restaurants typically target 30 to 35%. Fast-casual operations aim for 28 to 32%. QSR formats often run 25 to 30%. A 28% food cost is achievable across most full-service and fast-casual formats with disciplined systems in place.
What is prime cost and why does it matter?
Prime cost is your total food cost plus labor cost, expressed as a percentage of revenue. It is the single most important profitability metric for most restaurants. Operators focused only on food cost sometimes shift costs into labor without realizing it. Tracking prime cost alongside food cost gives you the full picture.
Ready to Close the Gap — on Food Cost and Prime Cost?
Book a free 20-minute strategy call. We will identify exactly where your food cost gap is, what your Prime Cost is running, and what it is costing your operation each month.
Book a Free Strategy Call →